We love Jozi—we build our lives, families, and careers here—and it’s where we invest in property. What a smart move that is.
Leadhome University has been researching property sales data to see how the average home price has changed over the last ten years, and it makes for some interesting reading. Our research focused on seven areas that make up the bulk of Joburg – Sandton, Randburg, Roodepoort, Johannesburg Central, Midrand, Edenvale, and Bedfordview.
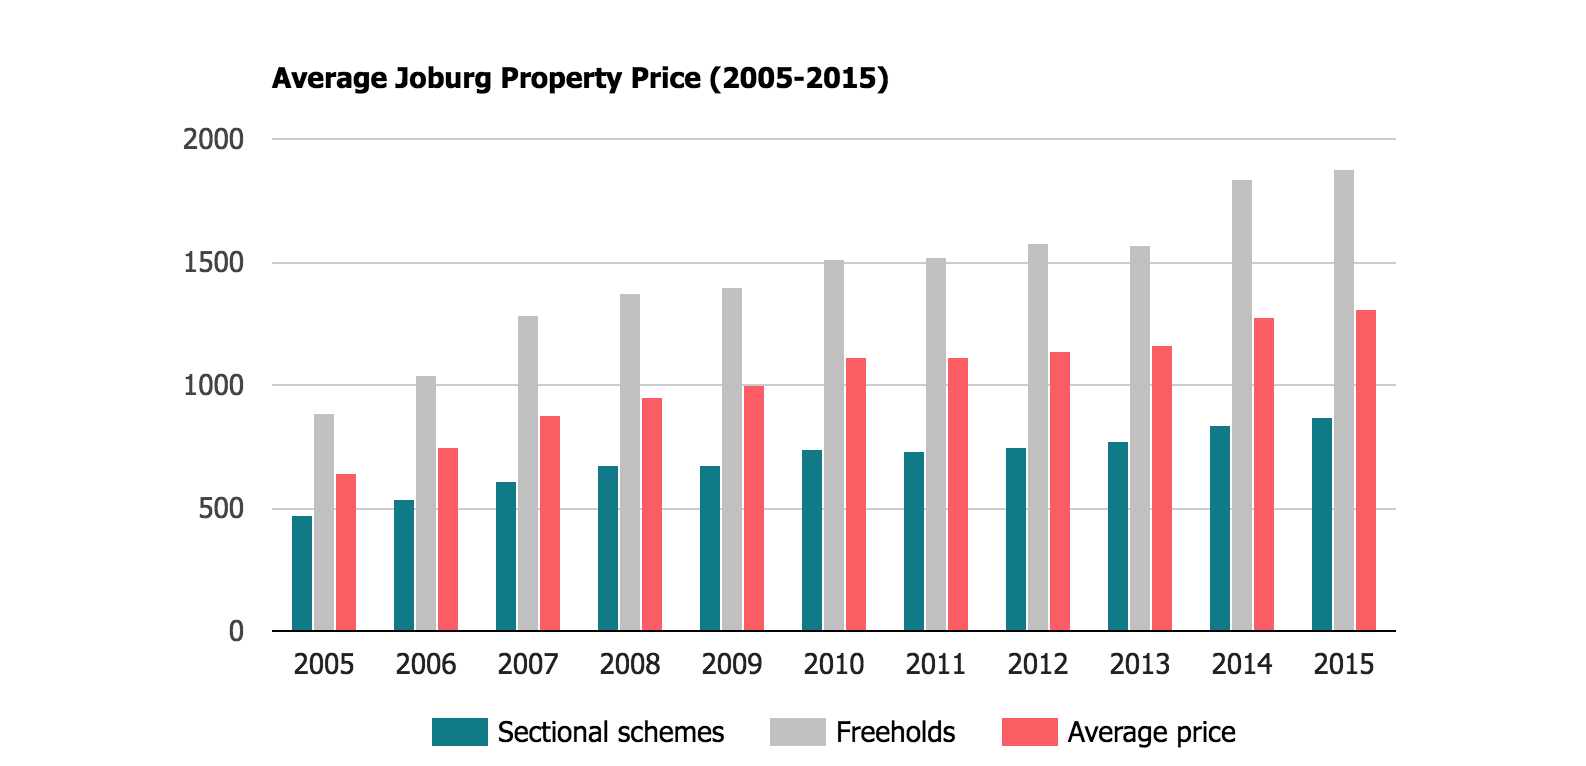
Growth above inflation
Since 2005, the value of the average Joburg property grew 7.3% per year. Of those, freehold properties grew at the highest rate—7.8% per year—compared to sectional schemes, which grew at 6.3%. The average price of a home in the 7 areas of Jozi is now R1.3 million (2005: R646,000), of which freeholds average R1.9 million (2005: R890,000) and sectional schemes R868,000 (2005: R473,000).
Interestingly, the price growth differential between freeholds and sectional schemes has accelerated over the last two years with buyers willing to pay a premium for space. Between 2013 and 2015, the average annual growth rate of freeholds has increased to 9.4%, compared to sectional titles at 5.9%.

But what does this mean for you as Jozi homeowner?
We have put together two sensitivity tables based on the observed growth rates of freeholds and sectional titles.
Find the price that you paid for your property in the top row. Then, find the year in which you purchased your property in the left-hand column. Trace where the row and the column intersect. This cell will show the theoretical price of your property based on the price growth per year over your period of ownership. Note that this assumes that your home is in the same shape it was when you bought it and that no additions (like a new kitchen) have been made.
If you bought a sectional scheme in 2007 for R750,000, its theoretical price today is R1.070,000 (4.5% growth per year). If you bought a freehold property in 2005 for R1,500,000, its theoretical price today is R3,170,000 (7.8% growth per year).
Sectional schemes
| 250 | 500 | 750 | 1,000 | 1,250 | 1,500 | 1,750 | 2,000 | 2,250 | |
| 2005 | 459 | 918 | 1,377 | 1,837 | 2,296 | 2,755 | 3,214 | 3,673 | 4,132 |
| 2006 | 403 | 807 | 1,210 | 1,613 | 2,017 | 2,420 | 2,823 | 3,226 | 3,630 |
| 2007 | 357 | 713 | 1,070 | 1,426 | 1,783 | 2,139 | 2,496 | 2,852 | 3,209 |
| 2008 | 323 | 646 | 968 | 1,291 | 1,614 | 1,937 | 2,259 | 2,582 | 2,905 |
| 2009 | 320 | 641 | 961 | 1,282 | 1,602 | 1,922 | 2,243 | 2,563 | 2,883 |
| 2010 | 294 | 588 | 882 | 1,176 | 1,471 | 1,765 | 2,059 | 2,353 | 2,647 |
| 2011 | 296 | 592 | 888 | 1,184 | 1,481 | 1,777 | 2,073 | 2,369 | 2,665 |
| 2012 | 289 | 578 | 866 | 1,155 | 1,444 | 1,733 | 2,022 | 2,310 | 2,599 |
| 2013 | 281 | 561 | 842 | 1,122 | 1,403 | 1,683 | 1,964 | 2,244 | 2,525 |
| 2014 | 259 | 518 | 777 | 1,036 | 1,295 | 1,554 | 1,813 | 2,072 | 2,331 |
| 2015 | 250 | 500 | 750 | 1,000 | 1,250 | 1,500 | 1,750 | 2,000 | 2,250 |
Freeholds
| 500 | 750 | 1000 | 1250 | 1500 | 1750 | 2000 | 2250 | 2500 | |
| 2005 | 1057 | 1585 | 2113 | 2641 | 3170 | 3698 | 4226 | 4754 | 5283 |
| 2006 | 906 | 1359 | 1812 | 2265 | 2718 | 3171 | 3624 | 4077 | 4530 |
| 2007 | 731 | 1097 | 1462 | 1828 | 2193 | 2559 | 2925 | 3290 | 3656 |
| 2008 | 686 | 1029 | 1372 | 1715 | 2058 | 2401 | 2744 | 3087 | 3430 |
| 2009 | 672 | 1008 | 1344 | 1680 | 2016 | 2352 | 2688 | 3024 | 3360 |
| 2010 | 622 | 933 | 1243 | 1554 | 1865 | 2176 | 2487 | 2798 | 3109 |
| 2011 | 619 | 929 | 1238 | 1548 | 1857 | 2167 | 2477 | 2786 | 3096 |
| 2012 | 596 | 894 | 1192 | 1490 | 1788 | 2086 | 2384 | 2682 | 2980 |
| 2013 | 598 | 897 | 1196 | 1495 | 1794 | 2093 | 2392 | 2691 | 2990 |
| 2014 | 511 | 766 | 1022 | 1277 | 1532 | 1788 | 2043 | 2299 | 2554 |
| 2015 | 500 | 750 | 1000 | 1250 | 1500 | 1750 | 2000 | 2250 | 2500 |
Although there are significant limitations to pricing a property on the basis of graphs and tables, we still hope this helps you understand how the current value of your property is based on market price growth. Should you wish to receive a tailored, in-depth valuation of your property, please do not hesitate to contact us for a free, no obligation valuation.
Next week we’ll dive down into these numbers and focus specifically on how Sandton’s property market has changed in the past ten years.
